Related articles
🍪✈️ The black box of your Rails app: what we monitor on our Fintech platforms

It’s 10:13 PM on a Tuesday. A user confirms a €15,000 outgoing transfer on your investment platform. The next morning, your client calls: the funds never left. No crash, no alert, and the confirmation page even displayed normally. What happened in your application at 10:13 PM last night?
If your only response is to reread the code in hopes of a sudden epiphany, this series is for you.
A Rails application in production is an opaque box. It processes thousands of requests, runs jobs, calls third-party services, and does it all without a witness. Logs and metrics are your black box—the kind found on an airplane. No one checks it while the flight is going smoothly, but the day something goes wrong, it makes the difference between understanding and guessing.
Observabilityis the ability to understand the internal state of a system based on what it emits: logs, metrics, and traces. An observable system isn't one that never fails; it's one that leaves actionable traces of everything it does.
At Capsens, we develop Fintech applications: platforms that sometimes serve tens or even hundreds of thousands of users, process funds, and operate under strict regulations. In this context, observability is a requirement. Being able to answer a regulator regarding your payment service's downtime this quarter, or to attest to the oversight exercised over a service provider, requires data measured continuously. It is also a matter of security: the same signals that reveal a bug can expose an ongoing attack. A spike in authentication errors at 3:00 AM rarely tells an innocent story.
This series features five articles: the first provides an overview of the metrics to track, while the next four move into practice (proper logging, tooling, detecting abnormal behavior, and managing it).
- Measuring reliability: the metrics that matter (this article): what to measure, why, and with which thresholds.
- Proper logging in Rails : what to log, how to structure errors, filtering sensitive data, and Lograge.
- Tooling your observability : availability, log centralization, error tracking, and notifications.
- Analyzing abnormal behavior : turning your logs into a detection tool.
- Rate limiting : building a limitation policy tailored to your user journeys.
We start with the metrics. Before installing a single tool, you need to know what you want to track. These metrics will also guide your maintenance efforts. For each metric, we will look at why your user, client, or regulator cares about it, how to measure it concretely in Rails, and a typical threshold to benchmark against.
Availability: the first metric to implement
Let's start with the simplest question you can ask an application: are you alive?
If your application provides a paid service, the answer to this question is likely already a contractual clause. Open the terms of service of any serious digital provider (AWS, Google Workspace, your e-signature provider): you will find a quantified availability commitment, usually reserved for paid plans, with penalties attached. It is a guarantee you can offer your own clients in your service levels. On one condition: you must measure it.
These commitments are also a sales lever: once the measurement is in place, nothing stops you from offering your services in tiers, with enhanced availability or dedicated monitoring justifying a more premium offering.
An SLA (Service Level Agreement) is a contractual commitment regarding the quality of a service, the most common of which is the uptime rate: the percentage of time the service responds normally, measured over a month or a year.
On the Rails side, the basic building block already exists: applications generated since version 7.1 expose a /up route that returns a 200 code if the application has started without exceptions.
# config/routes.rb
get "up" => "rails/health#show", as: :rails_health_check
It's a good start, but this check only tells you one thing: the Rails process is running. Your application can return a 200 on /up while its database is struggling. For more serious commitments, you should write a health check that verifies vital dependencies:
# app/controllers/health_controller.rb
class HealthController < ActionController::Base
  def show
    checks = {
      database: check { ActiveRecord::Base.connection.execute("SELECT 1") },
      cache: check { Rails.cache.write("health_check", Time.current.to_i) },
      queues: check { Sidekiq::Queue.new.latency < 5.minutes }
    }

    if checks.values.all?
      head :ok
    else
      Rails.logger.error("[health] #{checks.select { |_, v| !v }.keys.join(', ')} KO")
      head :service_unavailable
    end
  end

  private

  # Un service qui lève une exception est un service KO,
  # pas une erreur 500 sur le health check.
  def check
    yield.present?
  rescue StandardError
    false
  end
end
Note: we query the database with an actual SELECT 1 rather than connection.active?. The latter only checks the state of the connection pulled from the pool without a round-trip to the database: a connection closed on the server side (inactivity timeout, failover) can cause it to return false while everything is working, and cause phantom downtime in your monitoring.
Next, two golden rules. First, the probe querying this endpoint should ideally not live on your own infrastructure: if your server goes down, it takes the monitoring with it, leaving you blind at a critical moment. External services like Pingdom or UptimeRobot query your URL every minute from several regions around the world. Second, connect notifications to a channel that someone actually checks: team messaging, SMS, or calls, depending on the criticality. An alert that no one reads is useless.
Note: notice that the health check above returns a simple HTTP code, without details. A public endpoint that lists the status of your database, cache, and queues is a goldmine for an attacker during reconnaissance. Details belong in the logs, not in the response.
Typical threshold: 99% to 99.9% monthly, depending on the service, which is between seven hours and 43 minutes of tolerated downtime per month. Each additional nine increases the effort by an order of magnitude: know where to set the bar before promising it, and specify whether planned maintenance counts toward the calculation.
Error rate: not all errors are created equal
An available application is not necessarily a functioning one. It might respond to every request... with an error. Hence the second indicator: the error response rate. Here, the first digit of the HTTP code changes everything.
500 errors are your errors: an unhandled exception, a bug, or a third-party service that is no longer responding. They are always abnormal, and these are what standard contractual commitments cover, such as a server error rate of less than 1% per year. Your user cares because they just lost their subscription form; your client cares because every 500 on a payment flow is revenue evaporating.
400 errors, on the other hand, are ambiguous. An isolated 404 means nothing; no one makes contractual commitments regarding them. But in volume, they tell stories: repeated 404s on the same path reveal a broken link or poorly loaded assets; a burst of 404s on paths like /wp-admin or /.env signals a vulnerability scanner testing your surface; a series of 422s on an API reveals a client whose integration is malfunctioning. Nothing that justifies a middle-of-the-night alert, but a lot to learn by checking them regularly.
To count all this, you don't need an external tool: Rails publishes an event for every processed request that you can subscribe to.
# config/initializers/request_metrics.rb
ActiveSupport::Notifications.subscribe("process_action.action_controller") do |event|
  payload = event.payload
  # une exception non rattrapée ne produit pas de statut : c'est une 500
  status = payload[:status] || 500

  REDIS.hincrby("http_status:#{Date.current}", "#{status / 100}xx", 1)
rescue StandardError => e
  Rails.logger.error("[metrics] #{e.class}: #{e.message}")
end
Note: the rescue block at the end is not optional. Subscribers run in the request thread, and an exception that escapes them causes the request itself to fail: without this safeguard, an unavailable Redis would turn your metrics collection into a total outage. A principle to remember: monitoring must never be able to take down what it is monitoring.
A few lines, and you know every evening how many 2xx, 4xx, and 5xx responses your application has served. It's rudimentary, and the tools in article 3 will do much better, but the principle is there.
Typical threshold: a 5xx error rate of less than 0.1%, 0.5%, or 1%, depending on the service's requirements. Beyond 1%, errors become noticeable to regular users.
Critical paths: where the overall rate lies
An overall error rate of 0.05% is excellent. Unless those 0.05% are all concentrated on the payment endpoint. The overall rate is an average, and like any average, it masks the cases that matter: your homepage handles a hundred times more traffic than your subscription funnel, so it skews the calculation.
The solution is to track errors by controller and handle your critical business paths separately: payments, signatures, subscriptions—anything where failure immediately costs money or creates a liability. Our subscriber needs just a few extra lines:
if status >= 500
  route = "#{payload[:controller]}##{payload[:action]}"
  REDIS.hincrby("errors_by_route:#{Date.current}", route, 1)
end
Sort this hash every morning and you'll know where to focus your maintenance: the action accumulating the most errors is your priority, not the one people complained about loudest in meetings.
On the same principle, a business health check can go further than just verifying dependencies: periodically run a critical end-to-end path (create a test user, simulate a subscription in a controlled environment) to ensure not just that "the application is responding," but that "the application is doing its job." This is the level of assurance required by the strictest SLAs.
Typical threshold: for critical paths, we think less in terms of rates and more in terms of response time. A 500 error on a payment justifies an alert and priority handling.
Performance: slowness is an outage in disguise
Between "the application is responding" and "the application is responding in eight seconds," your availability monitoring sees no difference. Your user does. Three metrics are enough to cover the essentials.
Server response time, first. The average shows the trend but hides the extremes; your users live in the extremes. Hence the p95:
The p95 (95th percentile) is the value below which 95% of your response times fall. A p95 of 800 ms means that one in twenty requests takes more than 800 ms. The p95 shows you what your unluckiest users are experiencing, who are often your biggest clients since they are the ones with the most data to load.
Tracking response time is also a way of measuring a form of accessibility: a controlled p95 keeps the service usable from an average mobile connection or a modest device, not just from the office fiber connection. In practice, aim for a p95 between 800 ms and 1.2 s for web pages.
Time spent in the database, then, because it is the prime suspect when response times drift. Rails provides this for you request by request, in the same event as before:
duration = event.duration                # temps total (ms)
db = payload[:db_runtime]                # dont base de données
views = payload[:view_runtime]           # dont rendu des vues
The three should be read together: duration covers the entire request process, from the moment it hits the controller until the response is sent; db_runtime isolates the time spent executing SQL queries; view_runtime is the time dedicated to rendering templates. Whatever remains after subtracting these two values corresponds to your Ruby code: business logic, external service calls, and serialization.
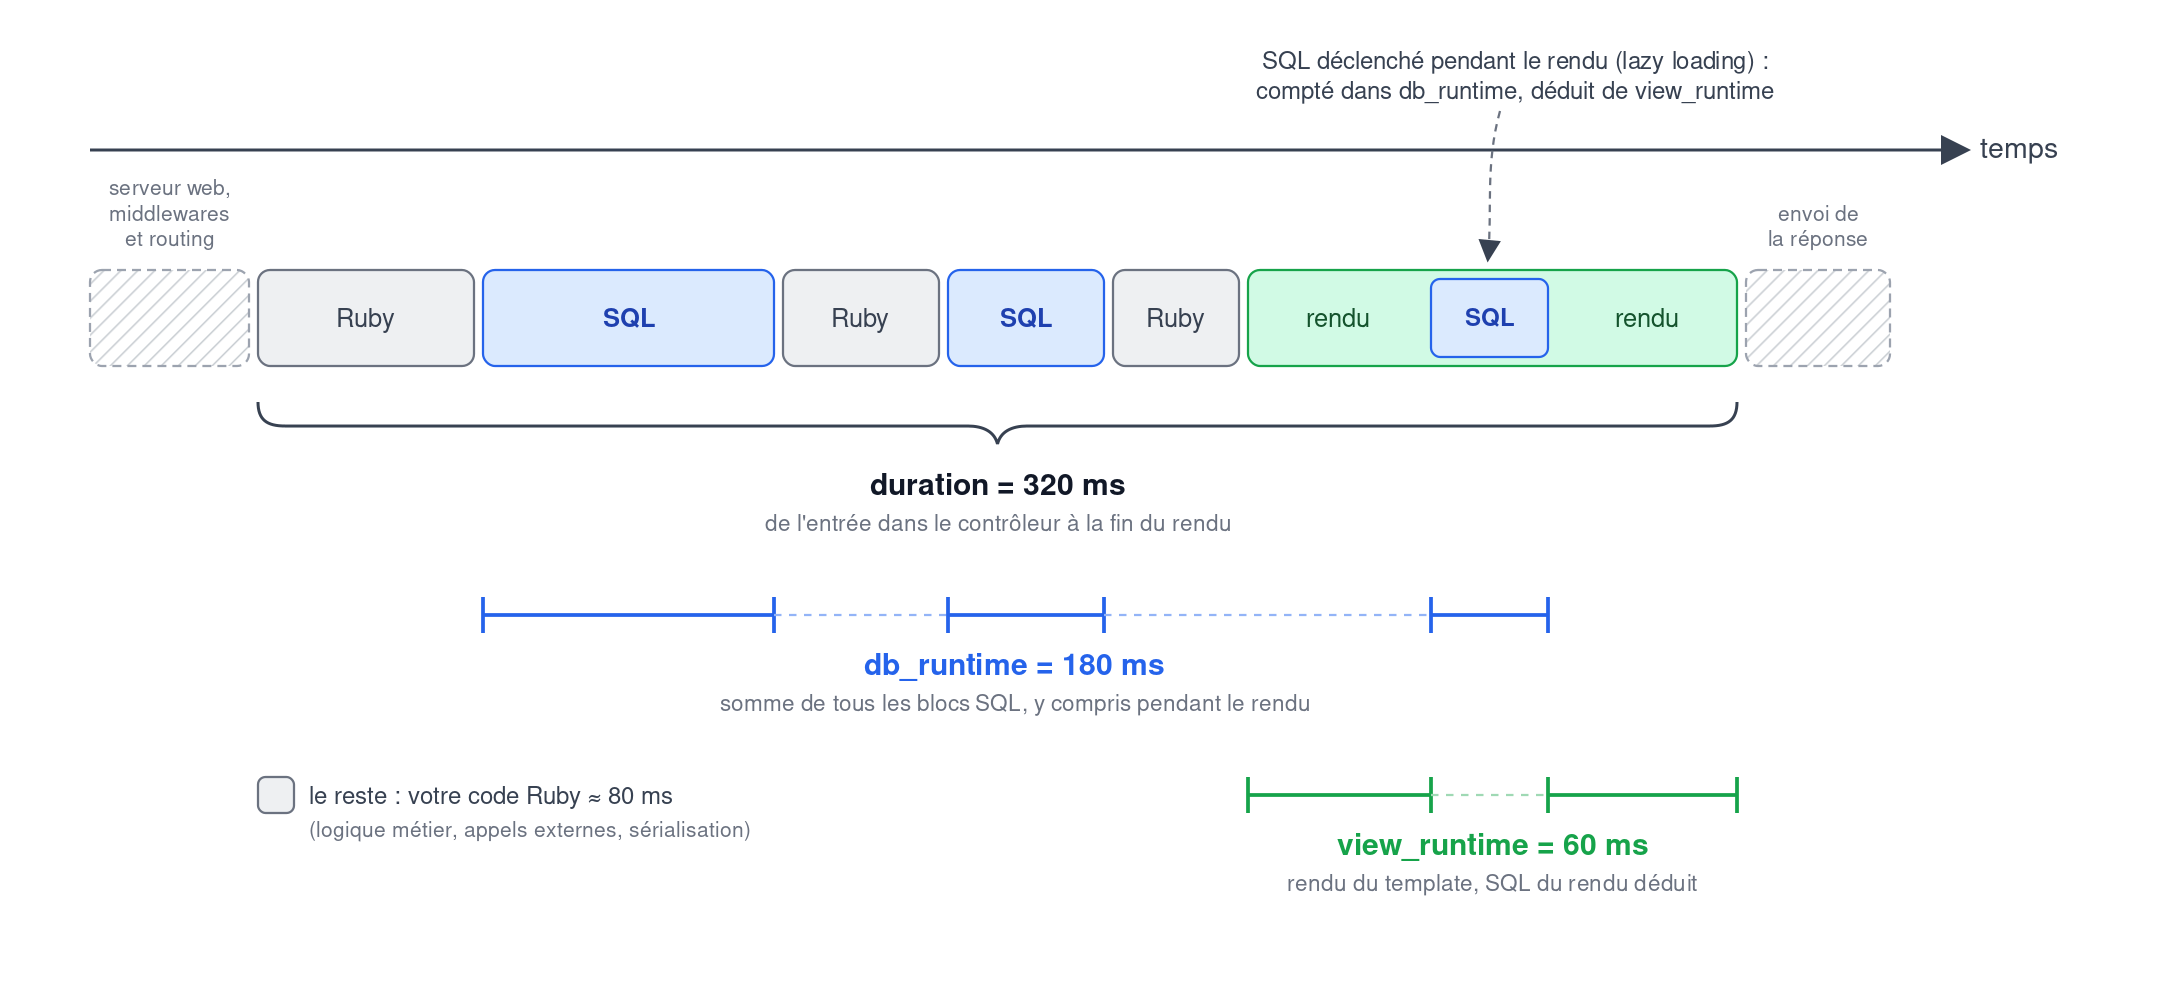
If db_runtime accounts for 80% of duration, there is no point in optimizing your Ruby code: you should be looking for an N+1 query or a missing index instead.
Asynchronous job latency, finally, the often-overlooked factor. Your emails, webhooks, and document generation handled by Sidekiq—a clogged queue is invisible from the browser... until a user has been waiting twenty minutes for their confirmation code. Sidekiq exposes this metric natively:
Sidekiq::Queue.new("mailers").latency
# => ancienneté (en secondes) du plus vieux job en attente
Typical thresholds: p95 between 800 ms and 1.2 s for web pages, queue latency under one minute for anything the user is actively waiting for. Adjust as needed, of course: a bank transfer can wait ten seconds, but a 2FA code cannot.
Weak signals: when metrics speak to security
Let's look at our HTTP codes one last time, this time from a security perspective. A spike in 401 and 403 errors is not a reliability issue: the application is doing exactly what it should by denying access. However, hundreds of 401 errors on your login page within ten minutes are often an indicator of malicious activity, such as a brute-force or credential stuffing attack. The counter set up earlier is already collecting these codes; all that is missing is an alert for them.
For our clients in the financial sector, this is no longer optional: the European regulation DORA, applicable since January 2025, requires financial entities to detect, classify, and report major information system incidents. When the time comes to document an incident, having a timestamped history of your 401 errors can be invaluable. Articles 4 and 5 of this series will be entirely dedicated to this security-focused interpretation of your metrics, leading up to the first level of response: automated response.
Status indicators: dependencies and MFA
Changing gears for the final section. The indicators we have looked at so far are measured over a period of time: we count requests, errors, and minutes of downtime. There is an entirely different family of indicators, known as status indicators, which are observed at a specific moment in time, much like a regularly checked inventory. Cyber compliance is full of them: the proportion of encrypted workstations, dormant accounts, tested backups, and patch application lead times. We will focus on two here that are particularly relevant for a Rails application.
Dependency health. Your Gemfile.lock is an inventory of code written by others, and any gem can be hit by a CVE. Auditing this can be automated with a single command, which you can plug into your CI:
bundle-audit check --updateThe tool (bundler-audit) compares your versions against the database of known vulnerabilities. Threshold: zero unaddressed critical CVEs, and ideally zero CVEs altogether. Keep an eye on version freshness as well: a dependency that is no longer maintained is a potential vulnerability.
MFA coverage. The percentage of users who have enabled two-factor authentication, which should be monitored as a priority for privileged accounts. Regulations like DORA actually mandate strong authentication mechanisms, making this rate as much a compliance indicator as a security one. If you are using devise-two-factor, the measurement takes just one line:
admins = User.where(role: :admin)
admins.where(otp_required_for_login: true).count.fdiv(admins.count) * 100
Threshold: 100% of administrator accounts. Without exception or forgotten service accounts: that is precisely the one that will end up in the incident report.
Note: beyond compliance, MFA has unique defensive value. Against certain attacks like credential stuffing, where the attacker presents a valid password obtained from a leak, it is the only barrier that still holds: no password policy can protect against a password that has already been compromised.
Reporting and automation
Once these indicators are collected, one final habit makes them truly useful: logging them. From an engineer's perspective, the job is done once the alerts are set up. From the perspective of the CISO or an auditor, it is only just beginning.
In cybersecurity, and particularly in legal compliance (GDPR, DORA, and other sector-specific regulations), one rule prevails: in the eyes of the authorities (CNIL, AMF, etc.), work that is not documented has not been done. You can track your metrics rigorously for months, but if there is no evidence of them, they will carry no weight during an audit.
Hence the final step: a scheduled job that compiles availability, error rates, p95, queue latency, dependency audit results, and MFA coverage into a report every week or month.
How you record information matters as much as the content itself. An ephemeral message in a chat channel has little evidentiary value: date your reports, store them in a dedicated, permanent space, and maintain a consistent format from one edition to the next to make trends easy to read. Archived in this way, these reports become an integral part of your compliance file, month after month.
In a nutshell
Ultimately, it takes very little code to achieve all this: Rails already instruments almost your entire application; you just need to leverage that data. These metrics are a starting point, enough to cover the essentials and spark ideas. Depending on your goals, you can go much further: SLOs and error budgets, distributed tracing, load testing, and end-to-end replayed user journeys. There is no need to deploy everything at once: start with the metric most relevant to your priorities and add the others over the following weeks.
As for our phantom 10:13 PM transfer, with these metrics in place, the payment queue latency would have triggered an alert even before the client called.
In the next article, we will learn how to configure our Rails application for proper logging: what to write, in what format, and what should never end up in your logs.
— Inès, Information Systems Security Manager at Capsens